HM Land Registry Price Paid Data (England & Wales)
Sold house prices in NW10: Brent
HouseCheckup is an independent service and is not HM Land Registry. We display official open data under the Open Government Licence and never charge for what GOV.UK provides free.
Type the full address with its postcode to go straight to your report options. Try .
- 65+ official sources
- Emailed within 24 hours, usually faster
- Sources and coverage gaps named
- One-off payment, no subscription
What the report looks like inside
See the full sample →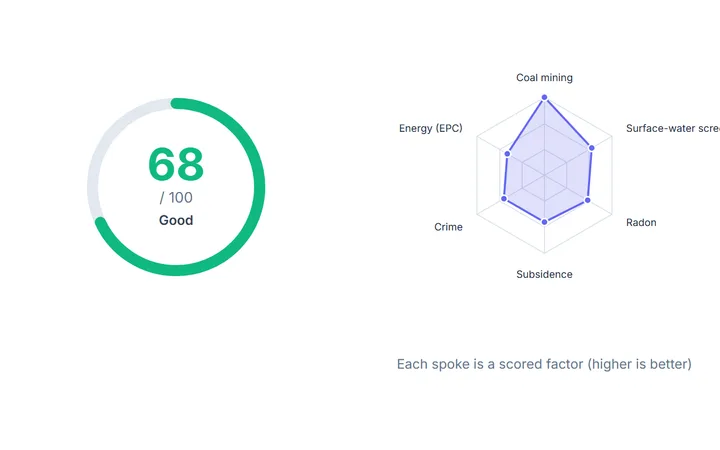 IQ Score and the factors behind it
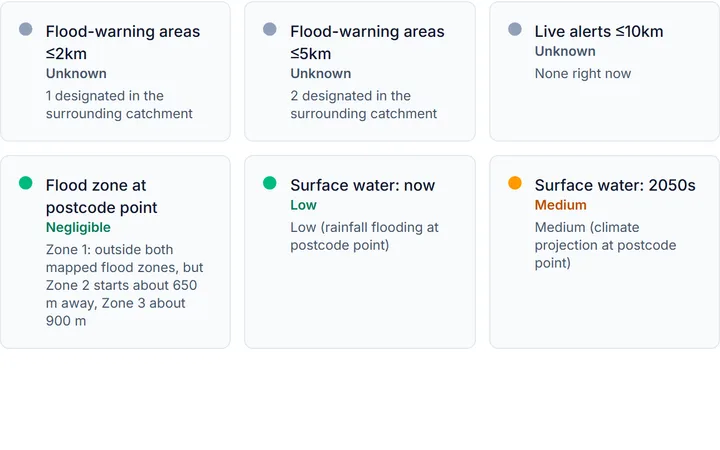 Flood risk at the postcode point
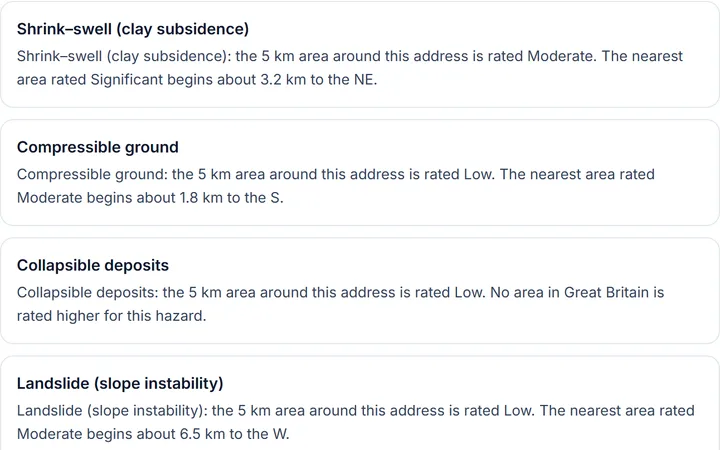 Six ground hazards, rated for the area
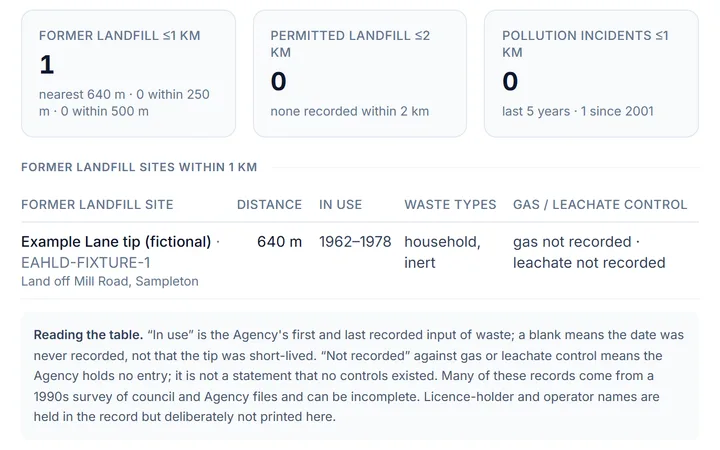 Landfill, permits and incidents nearby
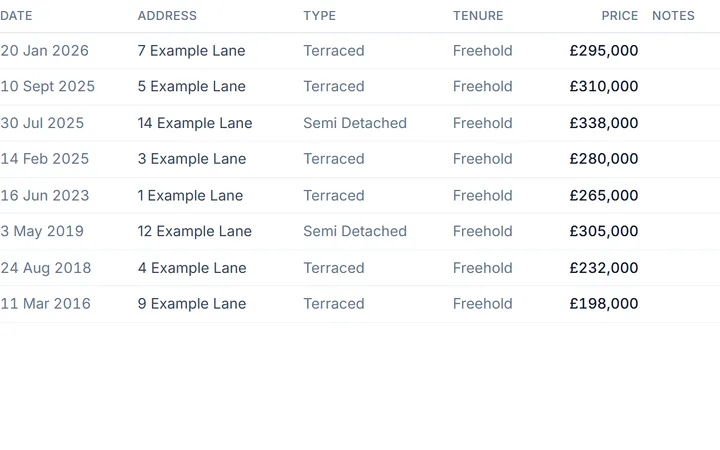 What homes here sold for
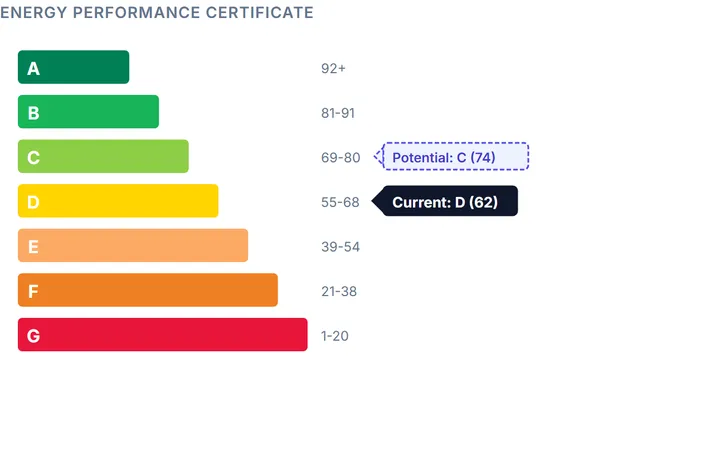 The energy rating, now and after upgrades
Illustrative sample · fictional address · cut from the sample report as it prints
HM Land Registry Price Paid Data covers NW10 (Brent), but we did not return a recent-sales sample for this outcode on the last refresh. Across Brent, the average price is £546,135 (-2.6% year-on-year). Search a specific address below for its full sold-price history.
See the full sold-price history for one NW10 address
Complete (£24.99) brings available property records into a human-checked report. Flood and ground screening, crime, energy and sale-record context have different source and location limits. Postcode and regional data cannot establish the condition of a building; unanswered checks remain explicit.
Type the full address with its postcode to go straight to your report options. Try .
£24.99 one-off · no subscription · Human-checked and emailed to you. See a sample report · Review report options and coverage
Cancel for a full refund at any time before your report is emailed. Terms
Price trend: NW10 in context
An outcode sample is small, so set it against the wider market. The UK House Price Index (UKHPI) tracks average prices and annual change for the local authority and region NW10 sits in:
| Area | Average price | Annual change | As of |
|---|---|---|---|
| Brent (local authority) | £546,135 | -2.6% | Jul 2026 |
| England & Wales (national) | £288,279 | +1.2% | Jul 2026 |
UKHPI is a mix-adjusted index published with a ~2-month lag. A street-level (HPSSA) small-area median is available from ONS as a bulk download. It is not yet wired here, so we never fabricate it.
Hazard flag for the NW10 area
Sold-price portals stop at the price. We pair it with a ground-truth risk screen at the representative point for NW10, the thing that actually moves value, insurance and mortgageability:
flood: none recorded · coal: no point match · subsidence: Probable · radon: 1/6
no recorded flooding
outside the queried coal coverage
clay-subsidence change Probable
radon band 1/6 (below Affected-Area threshold)
Hazard risk is mapped below outcode level, but these flags describe the area, not a single property. Check the exact address with the tools below.
See the full sold-price history for one NW10 address
This page is the area picture. To see the complete HM Land Registry sale history for one exact property (alongside its EPC, flood and ground risk, and a current valuation), search the address. The full breakdown is in the £24.99 Complete report.
Sources
- Price Paid Data, HM Land Registry
- UK House Price Index (UKHPI), HM Land Registry / ONS
- Outcode geocoding, postcodes.io
Contains HM Land Registry data © Crown copyright and database right 2026. This data is licensed under the Open Government Licence v3.0.
Flood data © Environment Agency copyright and/or database right 2026 (OGL v3.0). Flood Re eligibility based on floodre.co.uk criteria is indicative only; insurers make final decisions. Contains Mining Remediation Authority data © Mining Remediation Authority, licensed under the Open Government Licence v3.0. Contains British Geological Survey materials © UKRI 2026 (GeoClimate UKCP18 Open). Indicative Atlas of Radon. © Crown copyright UKHSA; contains British Geological Survey materials © UKRI. Open Government Licence v3.0.
What's in the report
A full PDF report bringing together available property risks, price history and neighbourhood context. A Complete report runs to 33 numbered sections in seven parts; Lite is the safety & environment part with the closing checklist and sources.
- The verdict
- Safety & environment
- Value & market
- The home & energy
- Area & lifestyle
- Written for the address
Price History
Every recorded sale on the street, with area price context.+5 checksShow detailsHide detailsHM Land Registry street and postcode transactions, plus local UK House Price Index context where available: every recorded sale on the street, newest first, with tenure, property type and new-build flags, typical price by property type, and how the local authority, region and nation compare
- Every recorded sale on the street and postcode
- Tenure, property type and new-build flags
- Typical price by property type
- Local authority, region and nation compared
- Local UK House Price Index context
Prints in: Value & market
Energy & Carbon
The whole energy certificate, running costs and improvements.+7 checksShow detailsHide detailsMatched EPC band, potential improvements, estimated energy costs and carbon emissions where a certificate is available. You get the whole certificate: every element the assessor rated with its star ratings, running costs now and after the costed improvements, rooms, glazing, validity, plus modelled solar potential
- Matched EPC band
- Every rated element with its star ratings
- Running costs now and after improvements
- Costed potential improvements
- Carbon emissions
- Rooms, glazing and validity
- Modelled solar potential
Prints in: The home & energy
Flood & Climate Risk
Flood maps, recorded flooding, defences and future scenarios.+8 checksShow detailsHide detailsFlood maps and recorded extents, with available future surface-water flood scenarios and coastal erosion data; coverage varies by nation. Included: every flood-warning area within 2 km and 5 km named, recorded flood events, river-flow climate allowances, Flood Re eligibility, and every flood defence within about 1.5 km with its condition
- Flood maps and recorded extents
- Future surface-water flood scenarios
- Coastal erosion data
- Flood-warning areas within 2 km and 5 km
- Recorded flood events
- River-flow climate allowances
- Flood Re eligibility
- Flood defences within about 1.5 km
Prints in: Safety & environment
Ground & Environmental
Ground hazards, radon, coal mining, noise and air quality.+7 checksShow detailsHide detailsBGS area hazard bands, radon potential, coal-mining screening, landslides, noise and modelled air quality: clay shrink-swell to the 2070s, the seven ground-hazard ratings with the distance to the nearest higher-rated cell, every recorded landslide nearby, the radon band for the 1 km square, and nitrogen dioxide, PM2.5 and PM10 against the legal objectives
- Clay shrink-swell to the 2070s
- Seven ground-hazard ratings
- Recorded landslides nearby
- Radon band for the 1 km square
- Coal-mining screening
- Noise
- Nitrogen dioxide, PM2.5 and PM10
Prints in: Safety & environment
Crime & Safety
Police-recorded crime by category, with the trend.+6 checksShow detailsHide detailsPublished police.uk crime categories and monthly history in England and Wales, with missing months explained: the last six months and the 24-month total within a mile, every category's share and per-month rate, and the change between the last six months and the six before
- Last six months within a mile
- The 24-month total
- Every category's share
- Per-month rate by category
- Change against the six months before
- Missing months explained
Prints in: Area & lifestyle
Schools & Healthcare
Schools nearby, plus GPs, pharmacies and health context.+5 checksShow detailsHide detailsSchools with available inspection information, OpenStreetMap amenities such as GPs and pharmacies, and census health context: every school within 4 km with phase, grade and distance, and the nearest GP, pharmacy and health services by name
- Every school within 4 km
- Phase, grade and distance
- Nearest GP by name
- Nearest pharmacy and health services
- Census health context
Prints in: Area & lifestyle
Local Transport
Stations and stops nearby, with distances.+3 checksShow detailsHide detailsNearby rail stations and public transport stops with distances, where the source has records: stations with mode and lines, every stop within 800 m by type, and the nearest bus stop
- Stations with mode and lines
- Every stop within 800 m by type
- The nearest bus stop
Prints in: Area & lifestyle
Demographics
Who lives here, and how the area ranks on deprivation.+6 checksShow detailsHide detailsNeighbourhood deprivation and available census data, with different sources for each nation: the decile and rank of the small area with domains where published, residents and households, every census category with count and share including household tenure, and the statistical type of area with its pen portraits
- Deprivation decile and rank
- Domains where published
- Residents and households
- Every census category with count and share
- Household tenure
- Type of area with its pen portraits
Prints in: Area & lifestyle
Planning & Heritage
Designations, listed buildings and what shapes change nearby.+10 checksShow detailsHide detailsPublished planning designations, conservation areas, listed buildings and major projects; local publication varies. Included: every listed building and conservation area within 700 m with grade and distance, green belt, National Landscape, national park, scheduled monuments, tree preservation orders, Article 4 directions, the local plan's status and every brownfield-register entry nearby
- Listed buildings within 700 m
- Conservation areas within 700 m
- Green belt
- National Landscape and national park
- Scheduled monuments
- Tree preservation orders
- Article 4 directions
- The local plan's status
- Brownfield-register entries nearby
- Major projects
Prints in: The home & energy
Lifestyle & Amenities
Walkability, everyday amenities and food hygiene ratings.+4 checksShow detailsHide detailsNearby mapped amenities, walkability context and food hygiene ratings where records are available: a walkability score out of 100, every everyday category counted with its nearest distance, and every rated food business within about a mile with type, rating and inspection date
- Walkability score out of 100
- Every everyday category counted
- Nearest distance for each category
- Rated food businesses within about a mile
Prints in: Area & lifestyle
Rental & Market Context
Indicative rental yield and local price trends.+4 checksShow detailsHide detailsIndicative gross rental yield from area rents and price data, plus local house-price trends where available: the yield, the typical monthly rent and the value it was measured against, labelled as an area estimate
- Indicative gross rental yield
- Typical monthly rent
- The value it was measured against
- Local house-price trends
Prints in: Value & market
Contaminated Land & Permits
Former landfill, permits, discharges and incidents nearby.+6 checksShow detailsHide detailsEvery former landfill within 1 km measured to its boundary with its years in use, every permitted landfill within 2 km, substantiated pollution incidents, and all permits and discharges within 1 km de-duplicated by site, with the statutory register named as not read and how to get it
- Former landfill within 1 km, to its boundary
- Years each landfill was in use
- Permitted landfill within 2 km
- Substantiated pollution incidents
- Permits and discharges within 1 km
- The statutory register and how to get it
Prints in: Safety & environment
Council Tax & Tenure
What every band costs, the neighbours' bands and tenure.+7 checksShow detailsHide detailsThe Band D charge for the local authority this year, what every band costs per year and per month, the band mix of the neighbours, the tenure at the last recorded sale and across the street, published tribunal decisions at the postcode, and the lease-pack checklist
- Band D charge this year
- Every band per year and per month
- The neighbours' band mix
- Tenure at the last recorded sale
- Tenure across the street
- Tribunal decisions at the postcode
- The lease-pack checklist
Prints in: Value & market
Findings for This Address
Written for this address from registers that software cannot read.+4 checksShow detailsHide detailsA section written for this address from the registers that publish to people but not to software (each finding names the register consulted, where and when), plus dated corporate ownership and building records with their match basis
- Findings from registers with no software feed
- The register, place and date for each finding
- Dated corporate ownership records
- Building records with their match basis
Prints in: Written for the address
Verdict, Surveyor Questions & Checklist
The IQ Score, every flag explained, and your next steps.+5 checksShow detailsHide detailsThe IQ Score with every factor's sub-score and the finding behind it, every red and amber flag explained, a numbered brief of questions for your surveyor built from what the address flagged, your before-you-offer checklist, and an appendix of every register asked and whether it answered
- IQ Score with every factor's sub-score
- Every red and amber flag explained
- A numbered brief for your surveyor
- Your before-you-offer checklist
- Every register asked, and whether it answered
Prints in: The verdict
Pages from the sample report
Open the full sample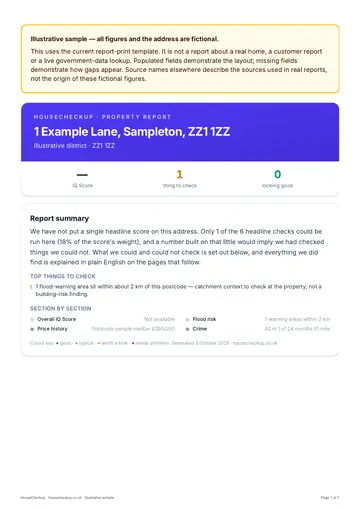 Report summary
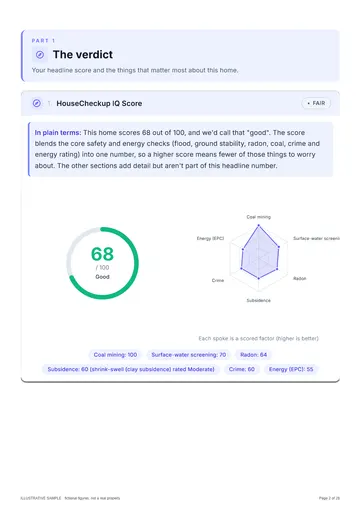 IQ Score and radar
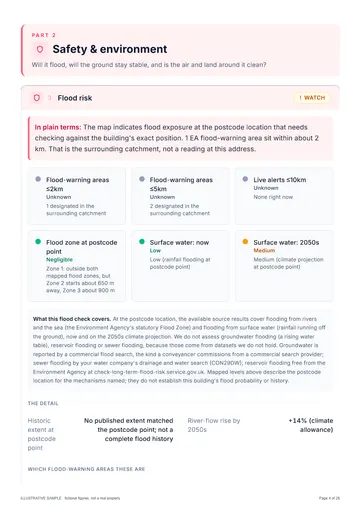 Flood risk
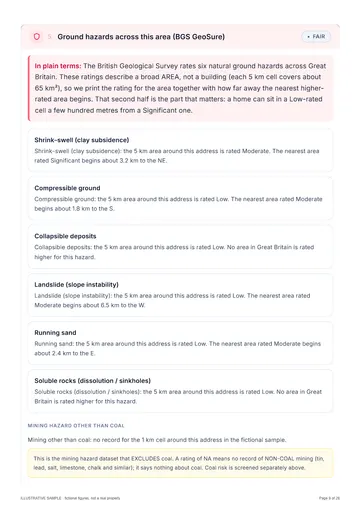 Ground hazards
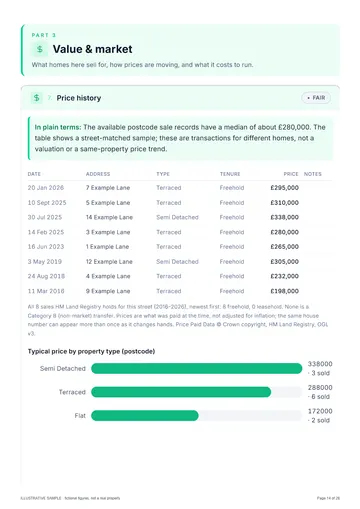 Price history
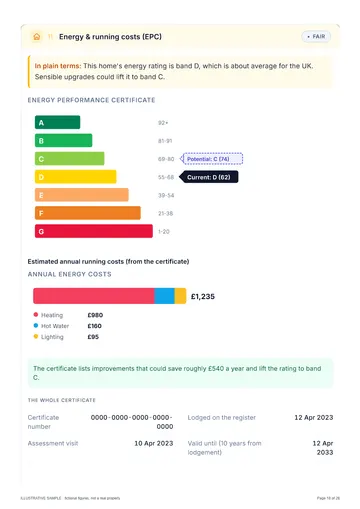 Energy (EPC)
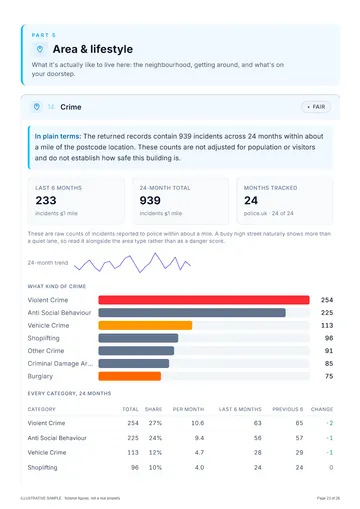 Crime
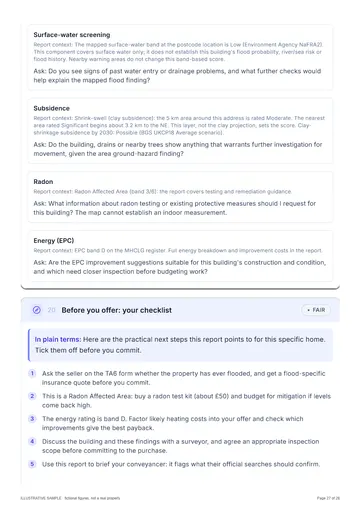 Questions for your surveyor
Illustrative sample · fictional address
How HouseCheckup works
From search to full report in three simple steps.
- England, Wales & Scotland
Search any address
Enter an address in England, Wales and Scotland. Coverage varies by nation and source.
- Before you pay
See the IQ Score
See an initial area risk screen where enough data is available, with the checks and coverage behind the score.
- Emailed within 24 hours
Get the full report
Choose Lite (£9.99) or Complete (£24.99). The report is emailed to you within 24 hours, usually faster, with every source named and any check it could not run stated.
Frequently asked questions
What is the average sold house price in NW10?
How many houses have sold recently in NW10?
Are there any flood, coal or subsidence risks in NW10?
How do I see what a specific NW10 house sold for?
Still have a question? We typically respond within 24 hours.
Ready to check a property?
Enter the address you are thinking of buying. See the available area risk data, then choose an emailed report for the property.
Type the full address with its postcode to go straight to your report options. Try .
Reports from £9.99, one-off. Compare Lite and Complete
Cancel for a full refund at any time before your report is emailed. Terms
At a glance
One-off
No subscription
Pay once for each report you buy.
Named
Sources & coverage
Every report names its sources and the checks it could not run.
GB
England, Wales & Scotland
Coverage varies by nation and source, and is stated.
£9.99
Reports from
Lite £9.99, Complete £24.99.