Quick answer
Among England's most affordable local authorities, the strongest gross buy-to-let yields in 2026 are in Middlesbrough and Blackpool (both ≈6.2%) and Kingston upon Hull (≈6.1%), followed by Sunderland (5.8%), County Durham and Stoke-on-Trent (both ≈5.6%). Every figure is computed from two official datasets: ONS Price Index of Private Rents mean monthly rents (April 2026) and HM Land Registry / ONS UK House Price Index average prices (March 2026), using the standard gross-yield formula (annual rent ÷ purchase price). Gross yield is the starting point, not the verdict: net returns depend on the exact street, the property's EPC and licensing position, and voids.
Already looking at a specific property in one of these areas? Run the £24.99 full report on that address.
How we ranked: methodology
We computed gross rental yield (mean monthly rent × 12 ÷ average purchase price) for England's most affordable local authorities, using only official published data: the mean monthly private rent per local authority from the ONS Price Index of Private Rents (PIPR, April 2026 reference period, edition published 20 May 2026) and the average property price per local authority from the HM Land Registry / ONS UK House Price Index (March 2026 release). Both sources are Open Government Licence v3.0. This is the same arithmetic every yield calculator uses; the difference is that both inputs here are official statistics for the same areas, stated with their reference dates, not portal estimates.
Scope note, honestly stated: the table ranks the affordable-authority cohort (England's lowest-priced local authorities by UKHPI), which is where headline gross yields concentrate. It is not a claim that no other UK area yields more; London boroughs with high rents can post similar gross figures at ten times the entry price and far lower yields, but pockets elsewhere can outperform.
Best buy-to-let areas 2026, ranked by computed gross yield
| Rank | Local authority | Avg. price (UKHPI, Mar 2026) | Mean rent (ONS PIPR, Apr 2026) | Gross yield |
|---|---|---|---|---|
| 1 | Middlesbrough | £138,207 | £709/mo | 6.2% |
| 2 | Blackpool | £135,792 | £700/mo | 6.2% |
| 3 | Kingston upon Hull | £134,719 | £689/mo | 6.1% |
| 4 | Sunderland | £145,546 | £699/mo | 5.8% |
| 5 | County Durham | £135,767 | £635/mo | 5.6% |
| 6 | Stoke-on-Trent | £150,990 | £708/mo | 5.6% |
| 7 | Darlington | £159,815 | £671/mo | 5.0% |
| 8 | North East Lincolnshire | £147,912 | £617/mo | 5.0% |
| 9 | Hartlepool | £136,532 | £566/mo | 5.0% |
Sources: HM Land Registry / ONS UK House Price Index, March 2026 release (average price, all recorded sales per local authority), landregistry.data.gov.uk/app/ukhpi; ONS Price Index of Private Rents, April 2026 reference period (mean monthly rent, all bedroom counts), ons.gov.uk. Both Open Government Licence v3.0. Gross yield = rent × 12 ÷ price, rounded to 0.1%.
Why gross yield is the start, not the verdict
Gross yield ignores everything that separates a good buy-to-let from a bad one at the same headline number:
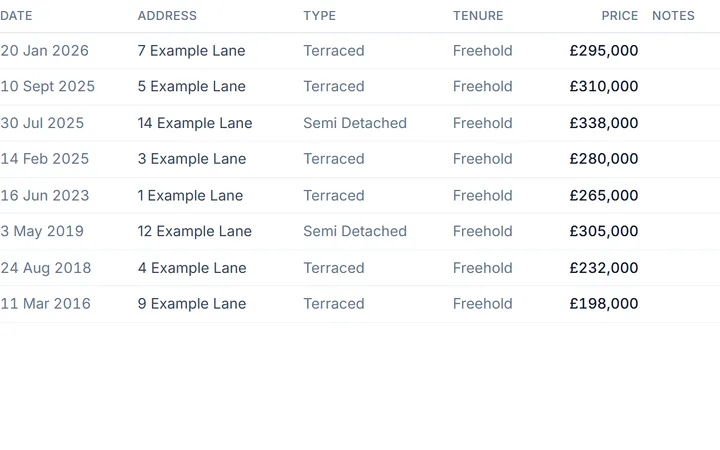
- The street, not the authority. A local-authority average blends the best and worst postcodes. Check what homes on the specific street actually sold for and how the outcode has moved.
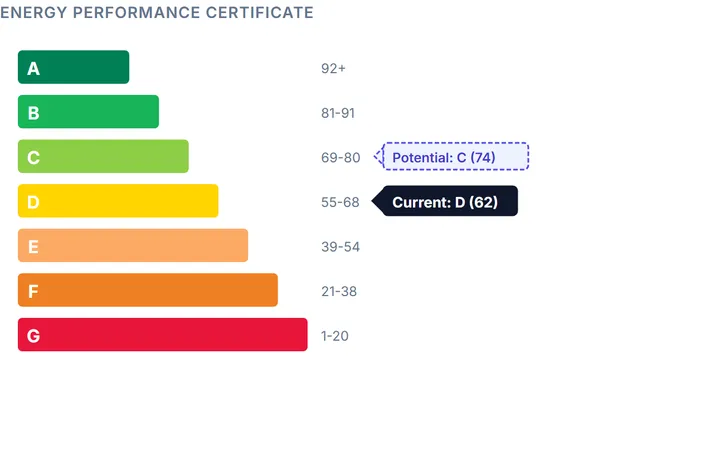
- EPC and MEES. Letting a home rated F or G is unlawful in England & Wales without a registered exemption, and the government has consulted on raising the minimum to band C, and a cheap band-E terrace can carry a four-figure upgrade bill before it earns rent.
- Licensing. Selective licensing schemes and HMO rules vary by council and can change the economics of exactly the high-yield areas above.
- Voids, management and maintenance. Net yield after costs typically runs well below gross; older, cheaper stock tends to cost more to keep tenanted.
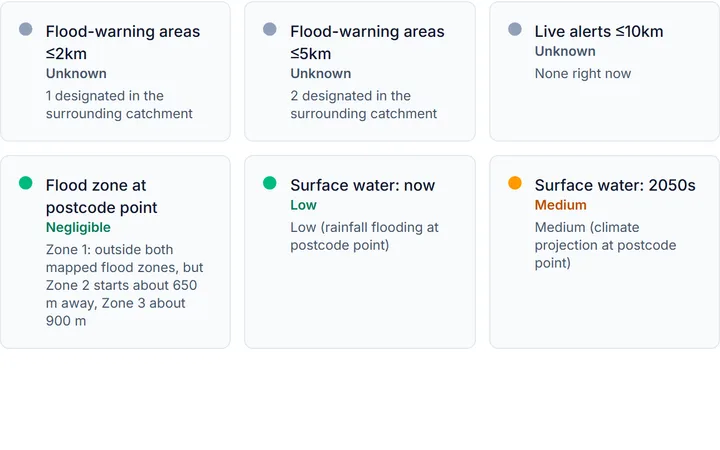
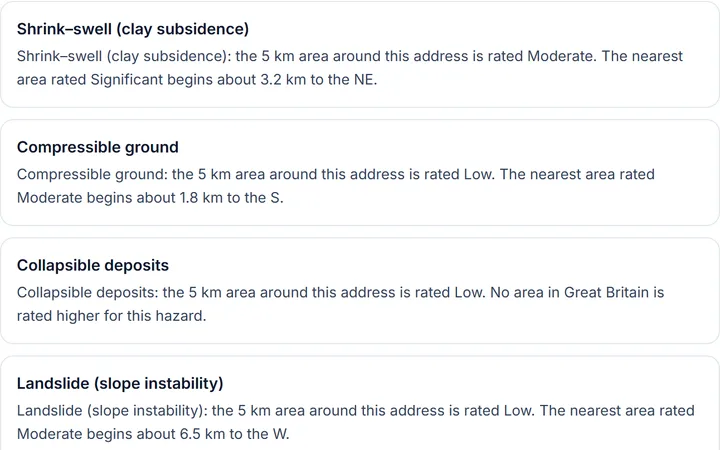
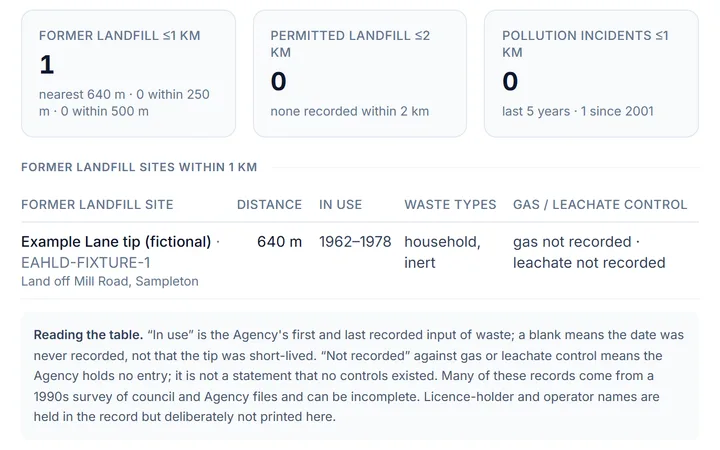
- Ground and flood risk. Several high-yield areas overlap with coalfield and flood-mapped geography, worth checking per address, not per headline.
How to underwrite a specific property
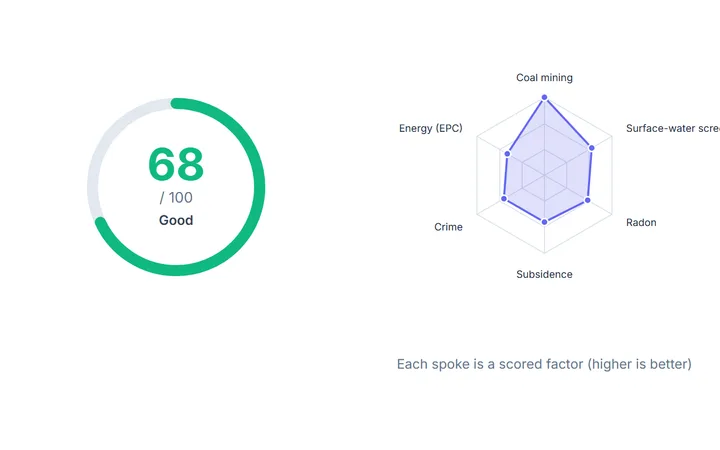
When an area on the table makes your shortlist: read the recent Land Registry sold prices for the outcode, check the EPC band for the exact property (and what the improvement list implies), and screen the ground stability and crime picture for the street. The £24.99 Complete report runs all of it (15+ checks from official sources) on the one address you're about to offer on.
Area data for places in this guide
Recent Land Registry sold prices and street-level police.uk crime data for the areas ranked above: the next step before checking an exact address.
Running the numbers on an area? Underwrite the address, not the average.
Yields are set by the street and the specific property. Sold-price history, EPC band (and MEES exposure), flood and ground risk all move the return. The £24.99 Complete report puts 15+ official-source checks on the exact address into one read.
Type the full address with its postcode to go straight to your report options. Try .
£24.99 one-off · no subscription · Human-checked and emailed to you. See a sample report · Review report options and coverage
Cancel for a full refund at any time before your report is emailed. Terms